An effective construction site dashboard is built on three pillars: KPIs updated in real time, automatic integrations with existing data sources (accounting, timesheets, BIM), and mobile access differentiated by role. Without these three elements, you get a dashboard that displays figures but does not guide decisions. With Edil-up, managers and site directors can launch a pilot on one or two sites in a few weeks, validate the chosen KPIs, and then extend the solution across the entire project. If you want to establish whether your organisation is ready, the quickest starting point is to request an assessment session with the Edil-up team before even choosing the widgets.
Key points
An effective construction site dashboard requires defined KPIs, standardised data upstream, and a data owner for each site: without these three elements, no platform delivers real value.
| Point | Details |
|---|---|
| Priority KPIs | Monitor budget variance, margin, actual versus planned hours, EV/SPI/CPI and supplier analysis. |
| Data before software | Standardise daily reports, timesheets and construction accounting before activating any dashboard. |
| Pilot on 1–2 sites | Start on sites with measurable problems; four weeks are sufficient to validate the chosen KPIs. |
| Separate physical obligation | The safety noticeboard and site sign remain separate physical obligations from the digital dashboard. |
| Edil-up as a starting point | Edil-up offers guided activation, integration with Italian management systems and a pilot with measurable results in one month. |
Contents
- What a construction site dashboard really is and when it is worth investing in
- The 5 essential KPIs for a construction site dashboard
- What features a dashboard needs to be useful every day
- What data is needed and how to integrate it into the dashboard
- How to implement a construction site dashboard: from pilot to rollout
- What to ask a supplier before choosing the software
- Case study: Edil-up applied to a renovation site
- Edil’s view on dashboards and data centralisation
- Edil-up: how to launch a pilot in a few weeks
- Sources
What a construction site dashboard really is and when it is worth investing in
A construction site dashboard is a centralised digital panel that aggregates a building project’s operational data in a single interface: costs, work progress, attendance, safety and documentation. It should not be confused with the mandatory physical noticeboard required by Italian regulations, which remains a separate obligation.
The physical site sign depends on the building authorisation (permit, SCIA, CILA) and municipal regulations, and contains information about the client, technicians and safety co-ordinators. The safety information board required by D.Lgs. 81/2008 is a separate physical obligation: management software supports workflows but does not replace the mandatory display. Anyone considering a digital platform must keep this distinction clear to avoid penalties.
That said, when should you prioritise the digital dashboard?
- Managing several sites in parallel: without a single control point, data arrives late and decisions are based on estimates.
- Costs out of control: if actual costs systematically exceed the estimate without a clear analysis of the causes, a tracking tool by cost type and supplier is needed.
- Reporting to clients or financing institutions: institutional dashboards show how real-time visualisation of project summaries and groupings has become an expected standard outside the private sector too.
- Recurring safety problems: the information board must list the employer, RSPP and RLS, together with updated emergency procedures; a digital platform helps keep this data synchronised and accessible, while not replacing the physical display.
- Document-compliance requirements: PSC, POS, preliminary notices and inspection reports must be retrievable within seconds.
The 5 essential KPIs for a construction site dashboard
Not all KPIs are equal. These five cover the dimensions that really matter to a site manager: costs, productivity, progress and profitability.
1. Budget variance (%)
Formula: (Actual cost – Estimated cost) / Estimated cost × 100
A positive value indicates an overrun. It should be updated at least weekly; the administrative manager enters actual costs, while the site director checks consistency with physical progress.
2. Site margin
Formula: (Revenue – Total costs) / Revenue × 100
This KPI shows whether the site is generating value or eroding the company’s margin. A margin below the planned contractual threshold is the clearest sign that something is wrong, whether with costs or with variations not recognised by the client. It should be updated monthly, with shared responsibility between the technical office and administration.
3. Actual versus planned working hours
Formula: Actual hours / Budgeted hours × 100
Daily timesheets completed on site using a mobile app are the most reliable source; without this structured collection, the KPI becomes an estimate and loses its decision-making value. On-site attendance tracking integrated with the dashboard eliminates duplicate manual entry.
4. Earned Value (EV) and SPI/CPI indices
Earned Value is the value of work actually completed, expressed in financial terms.
- SPI (Schedule Performance Index): EV / Planned Value. Below 1.0 means delay.
- CPI (Cost Performance Index): EV / Actual Cost. Below 1.0 means a cost overrun.
These indices, even in the simplified version used on medium-sized sites, allow the estimate at completion (EAC) to be projected before the problem becomes irreversible. Monthly updates are sufficient for sites lasting more than six months.
Advice: Do not calculate EV for the entire site in one go. Start with two or three high-cost activities and check that physical-progress data is reliable before extending the method.
5. Cost analysis by type and supplier
This is not a single number but an aggregated view: how much is labour, how much materials, how much plant hire, and which suppliers have the greatest impact on the total. This analysis allows informed negotiation and rapid identification of suppliers generating recurring variances. The recommended frequency is monthly, with an exceptional analysis whenever budget variance exceeds the warning threshold.
The most effective dashboards emerge from digitalisation processes that are already under way: digital registers, mobile daily reports and accounting integration. Software becomes useful when data is standardised upstream, not before.
What features does a dashboard need to be useful every day?
KPIs are what to monitor. Features are how to collect the data and turn it into decisions. Here is what to ask any platform before signing a contract:
- Mobile daily reports: completion on site, even offline, with automatic synchronisation. Each report becomes an input for daily cost tracking, eliminating manual transfer at the end of the week.
- Geolocated photographs: documentation of work progress with timestamps and GPS coordinates. Useful for disputes, inspections and reporting to clients.
- Materials tracking: recording orders, deliveries and waste. Linked to the budget, it makes it possible to see in real time how much material has been consumed compared with the estimate.
- WBS progress tracking: a Work Breakdown Structure linking each activity to the corresponding budget. For effective BIM integration, mapping WBS ↔ project ↔ activity is the technical step that links quantities and physical progress with estimated and actual costs.
- Document management: storage and versioning of PSC, POS, plans, minutes and certificates. Role-based access (works director, safety co-ordinator, client).
- Notifications and SLA alerts: automatic alerts when a KPI exceeds its threshold, a document deadline approaches or a supplier has not delivered within the expected time.
- Safety module: integration with the Operational Safety Plan (POS) and preliminary notice. The digital safety board must include key roles (employer, RSPP, RLS) and emergency procedures, updated whenever names or procedures change.
- Role-configurable widgets: the project manager sees costs and progress; the worker sees the day’s activities and safety instructions; the client sees a summary of progress and expenditure. One platform, different views.
Apps for checklists and site inspections integrated with the dashboard complete field data collection, reducing the risk of omissions during inspections.
What data is needed and how to integrate it into the dashboard
A dashboard is only as valuable as the data that feeds it. There are six main sources:
| Data source | Recommended format/integration | Update frequency |
|---|---|---|
| Daily reports and timesheets | REST API or daily CSV import | Daily |
| Supplier orders and invoices | ERP integration or import from accounting software | Weekly or on receipt |
| Construction accounting | Connector with accounting software (e.g. Zucchetti, TeamSystem) | Monthly or weekly |
| BIM and plans | IFC, DWG, georeferenced PDF | At each model revision |
| Plant telemetry and IoT sensors | Telematics provider API or MQTT | Near-real-time or hourly |
| Attendance tracking | Badge, QR code or mobile app with automatic synchronisation | Daily |
Three practical rules help guarantee data quality:
Mandatory minimum fields. Every daily report must contain at least: date, site, activity (WBS code), hours per worker and materials used. Without these fields, the data does not enter the dashboard.
Weekly validation routine. The site manager checks that the week’s data is complete and consistent before the following Monday. If this routine is missed, gaps accumulate and make the KPIs unreliable.
One data owner per site. One person is responsible for data quality: this does not mean entering everything, but checking and correcting it. Without this role, responsibility becomes dispersed.
Advice: For BIM integration, do not try to connect the entire model to the dashboard from the first day. First map high-cost activities (structures, building services) and check that physical progress can be measured with the available data. Then extend the method.
The digital site register is often the most practical starting point: it standardises entry fields and creates the basis for building subsequent integrations.
How to implement a construction site dashboard: from pilot to rollout
Implementation is not an IT project: it is an operational change. The sequence that works best has six phases.
Phase 1: Scoping (1–2 weeks)
Define measurable objectives (for example, two sites are enough: one with cost problems and one with progress problems).
Phase 2: Pilot (4–6 weeks)
Activate the platform on those two sites, collect data using existing processes and check that the KPIs can be calculated. This phase reveals data gaps: missing sources, non-standardised fields and operational resistance.
Phase 3: Data integration (2–4 weeks, in parallel with the pilot)
Connect priority sources (timesheets, accounting, orders). The simplest integrations (CSV imports) can be activated in days; those using APIs require the involvement of the management-software provider.
Phase 4: User testing and training (2 weeks)
Involve key roles: site director, administrative manager and safety co-ordinator. Training must be practical, not theoretical: each role learns to use the widgets relevant to it, not the entire platform.
Phase 5: Rollout (4–8 weeks)
Extend the solution to the other sites with a structured onboarding plan. Those who took part in the pilot become the internal reference point for their colleagues.
Phase 6: Continuous maintenance
Review KPIs monthly (are they still relevant?), update warning thresholds and check data quality. A dashboard is not a project that closes: it is a process.
| Phase | Estimated duration | Primary person responsible |
|---|---|---|
| Scoping | 1–2 weeks | Technical director / PM |
| Pilot | 4–6 weeks | Site manager + IT |
| Data integration | 2–4 weeks | IT / platform provider |
| Testing and training | 2 weeks | PM + HR / training |
| Rollout | 4–8 weeks | PM + site managers |
| Maintenance | Ongoing | Data owner per site |
What to ask a supplier before choosing the software
Choosing software is a decision that lasts for years. The right questions filter suppliers in a few hours.
Security and compliance: Are the data hosted in Europe? Is the supplier GDPR-compliant and able to provide a DPA (Data Processing Agreement)? Where are backups carried out and how often? What SLA is guaranteed for restoration in the event of an incident?
Integrations: Is there a documented public API? Which native connectors are available for the most widely used accounting systems in Italy (Zucchetti, TeamSystem, Passepartout)? Does the mobile app work offline?
Scalability and price: Does the pricing model scale by number of sites, users or features? What integration and training costs are not included in the subscription? What is the total cost of ownership (TCO) over three years?
Data portability: If you decide to change platform, can historical data be exported in an open format (CSV, JSON, XML)? How long will it take?
Some situations should make you suspend negotiations without hesitation:
- No documented APIs: this means data is locked into the platform.
- No granular role control: everyone can see everything, including sensitive data on costs and suppliers.
- Backups not guaranteed contractually: there is no protection in the event of data loss.
- Data cannot be exported or can only be exported for a fee: commercial lock-in disguised as a feature.
Document management is often the first point of failure: check that the system supports versioning, role-based access and long-term archiving before any other assessment.
Case study: Edil-up applied to a renovation site
Context. A construction company with three active sites at the same time, all lasting more than twelve months, was losing control of costs on two of them. Daily reports were on paper, construction accounting was updated every two weeks and budget variance was detected only at the end of the month, when it was already difficult to correct course.
Intervention. The company activated Edil-up on a pilot site, connecting mobile daily reports to construction accounting and configuring three main KPIs: weekly budget variance, actual versus planned hours by activity and cost analysis by supplier. Training required two two-hour sessions for site managers.
Results after the first quarter:
- Reduction in the delay in detecting variances: from two weeks to two days.
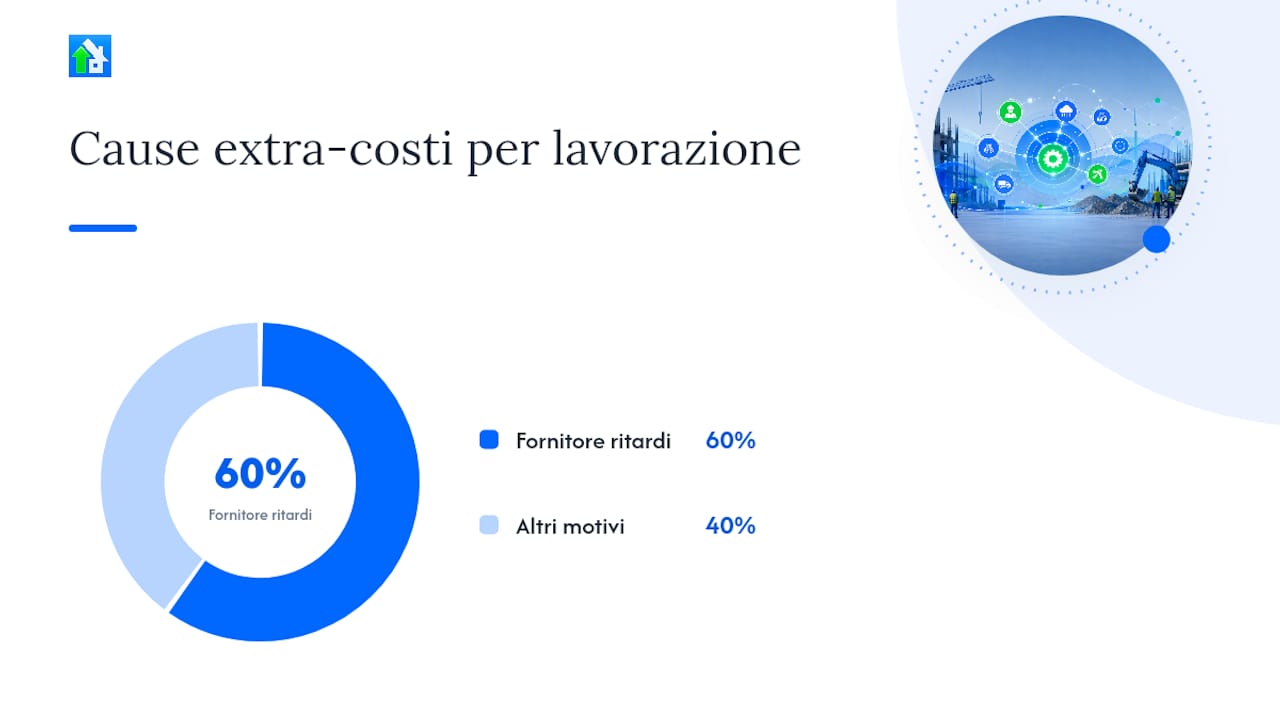
- Identification of a materials supplier whose deliveries were systematically late, the main cause of 60% of the extra costs for that activity.
- Document progress (POS, minutes) always up to date and accessible to the safety co-ordinator without email requests.
Edil-up states that centralised project management can reduce delivery times by up to 20%.
The dashboard did not solve the site’s problems. It made the problems that already existed visible early enough to address them. That is the difference between a useful tool and a decorative one.
Practical takeaways replicated on the other sites:
- Define a maximum of three KPIs for the first month of the pilot, not ten.
- Appoint a data owner for each site before activation, not afterwards.
- Connect mobile daily reports first, then accounting: field data is the basis for everything else.
Edil’s view on dashboards and data centralisation
There is a widespread belief in the sector that a dashboard solves management problems. It does not. It makes them visible, which is different and, in some cases, more uncomfortable. A site that performs badly with Excel spreadsheets will also perform badly with a digital platform, only with more data available to document the problem.
The real value of a tool such as Edil-up does not lie in the widgets or charts: it lies in the fact that it forces the organisation to standardise data-collection processes before it can use any visualisation. This standardisation alone produces operational improvements, regardless of the platform chosen.
I need to be direct on one point: Edil-up is the publisher of this article and the supplier of the solution described. This is a real conflict of interest, and readers have the right to know. The recommendation of Edil-up as a starting point is genuine, but the final assessment belongs to those who know their own site better than anyone else.
Practical advice for tomorrow: do not start with the choice of software. Start by defining three KPIs that you currently cannot calculate in less than an hour. If you cannot answer that question, no platform will help until you have solved the underlying problem.
Edil-up: how to launch a pilot in a few weeks
Those managing sites with cost-control or progress problems need measurable results, not a six-month IT project. Edil-up is built for this: rapid activation, guided KPI configuration and integration with the management systems already in use.
A standard Edil-up pilot covers one or two sites, lasts four weeks and includes configuration of priority KPIs, connection to existing data sources and two training sessions for managers. At the end of the pilot, you have real data on which to decide whether to extend the solution. No long-term commitment before you have seen the results.
To start the pilot, you need: a list of active sites with their budgets and expected durations, access to the accounting system for the data connection and the name of the person who will act as the internal point of contact.
See the pricing plan or contact the team to book a free assessment session and establish which configuration suits your company’s structure.
Sources
The resources below cover three distinct areas: regulatory compliance, technical implementation and operational tools.
For regulatory compliance:
- Dashboard – Osserva Cantieri
- Site sign: template, obligations and penalties
- Complete guide to the site sign: regulations, requirements and penalties | Unione Architetti
- What must I display on the information board? – RAMS boards Italiano
For technical implementation:
For operational tools:
Recommended
- Best construction site checklist apps for managers 2026
- Construction site attendance tracking: 2026 guide
- Digitalisation in construction: how to prepare for the future – Edil-up – Sustainable construction for the future
- How to build a network of contacts in construction – Edil-up – Sustainable construction for the future